Washington, DC - Usually a Top 10 list is something industries are delighted to find themselves on. So we’ll call this one a Flop 10 list, the FTC’s annual report about consumer complaints added in 2015 to the Consumer Sentinel database. How did your industry – and your state – rank in reported complaints?
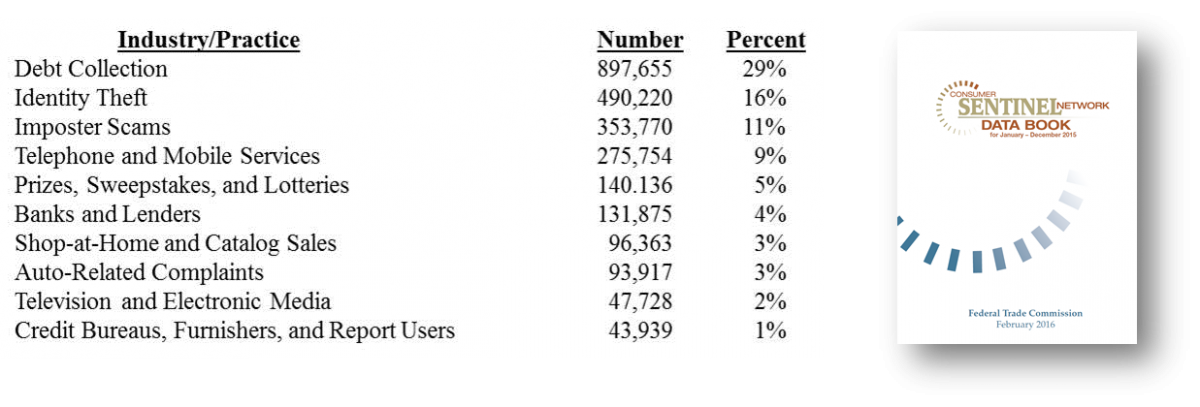
First, the box score:

We spend a lot of time throughout the year pouring through the raw data, but here are some initial observations:
- The Consumer Sentinel Network received more than 3 million complaints last year. In addition to those filed directly with the FTC, the database includes complaints compiled by other contributors – consumer protection agencies, business groups, nonprofits, etc. (By the way, we report separately about Do Not Call complaints, so those numbers aren’t included in the 3 million.)
- There was an uptick in complaints about debt collection. The FTC was on the case, bringing a record number of law enforcement actions in 2015. Challenging illegal debt collection practices continues to be a high priority in 2016. The increase in collection-related complaints was due in part to the large number received from one data contributor – which is as good a time as any to remind groups that if you collect complaints, consider contributing them to the Consumer Sentinel database. Of course, the pipeline goes in only one direction. Because complaints are nonpublic, contributors can’t access information in the database unless they’re bona fide law enforcement agencies that meet the Consumer Sentinel Network’s rigorous training and security requirements.
- Of the 1.2 million fraud-related complaints, just over half of consumers reported how much they paid. The median amount was $400, totaling $765 million. How did fraudsters make their pitch? The consumers who answered that question said that 75% was by phone, 8% by email, and 4% by mail.
- Of the 2015 identity theft complaints, 45% related to tax or wage ID theft, 16% concerned credit card fraud, and 10% were related to phones or utilities.
- 37% of identity theft complainants contacted law enforcement. Of those folks, 89% say that officers took a report, indicating just how seriously law enforcers take ID theft.
- The report includes some interesting state-by-state data. For example, what state reported the highest per capita rate of fraud and other types of complaints? Here’s a hint: They’re also known for sunshine and citrus. Florida took the top spot, with Georgia and Michigan ranking second and third. What about ID theft? The highest per capita rate of reported identity theft came from Missouri – giving a whole new meaning to “The Show Me State.” Next on the list were Connecticut and Florida. But here’s an important caveat: We’re talking about reported complaints, which means there’s no way to accurately differentiate between states with a high incidence of fraud and identity theft vs. states with savvy consumers who are more likely to file a complaint if they’ve been victimized.
For every category of complaint, the FTC has tips for consumers. The advice ranges from how to exercise their legal rights or spot a scam to protecting their personal information and creating a personal ID theft recovery plan. Make it your business this year to share those tips with customers, employees, friends, and your social networks.
